ImmunomeBrowser - Tutorial
This tool map the epitopes based on selected sequence identity to the given parent antigen sequences. The details of the immuomme browser and its statistical calcualtions are available at IEDB help documents. Please click here to see the document.
To read the full article related to custmized application of ImmunomeBrowser, please read the following article
Sandeep Kumar Dhanda, Randi Vita, Brendan Ha, Alba Grifoni, Bjoern Peters, Alessandro Sette (2018). ImmunomeBrowser: A tool to aggregate and visualize complex and heterogeneous epitopes in reference proteins. Bionformatics, bty463
PMID: 29878047
Click here to read the full text
Sandeep Kumar Dhanda, Randi Vita, Brendan Ha, Alba Grifoni, Bjoern Peters, Alessandro Sette (2018). ImmunomeBrowser: A tool to aggregate and visualize complex and heterogeneous epitopes in reference proteins. Bionformatics, bty463
PMID: 29878047
Click here to read the full text
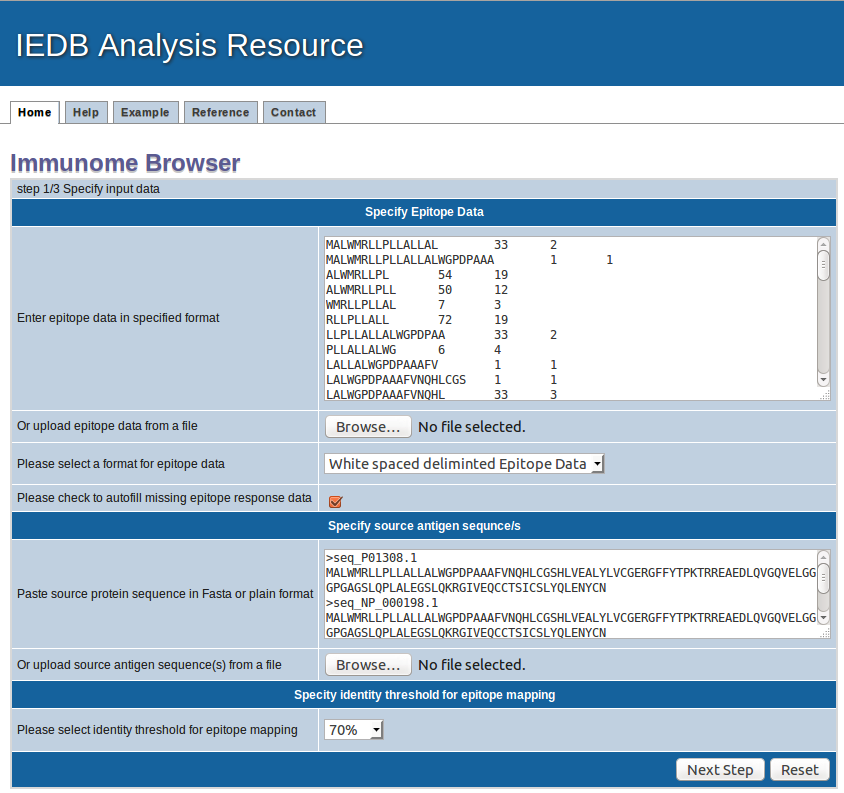
How to use the tool : Step 1
1. Specify epitope data
Epitope sequences can be either directly entered in the text area or uploaded from a file. To upload data from a file, click the "Browse" button
to select a file. File content will then be shown in the text area. Two acceptable sequence formats are white spaced deliminated text format and FASTA format. A sequence in PLAIN format
is separated by a new line. A sequence in FASTA format begins with a
single-line description, followed by line(s) of sequence data. The description line is distinguished from the sequence data by a greater-than
(">") symbol in the first column.
2. Specify epitope data format
Please provide epitope data either in white space formatted or FASTA format and choose appropirate foramte here
Please also check the box to automatically filling the missing response data. The box should be checked for FASTA formatted data or your TSV or white deliminated file has some epitope with missing response data. It will automatically fill in the value of 1 in subjects tested and 1 in subjects responded in such cases.
Please also check the box to automatically filling the missing response data. The box should be checked for FASTA formatted data or your TSV or white deliminated file has some epitope with missing response data. It will automatically fill in the value of 1 in subjects tested and 1 in subjects responded in such cases.
3. Specify antigen sequence(s)
Please provide the antigen (protein) sequences in PLAIN text or in FASTA format. In case of PLAIN text, each line will be treated as indivial sequence.
4. Specify calculation options
Sequence identity threshold: Select the sequence identity threshold at which you want to calculate epitope clusters.
5. Submission
Click "Next step" to start calculation or "Reset" to clear input parameters.
Example input
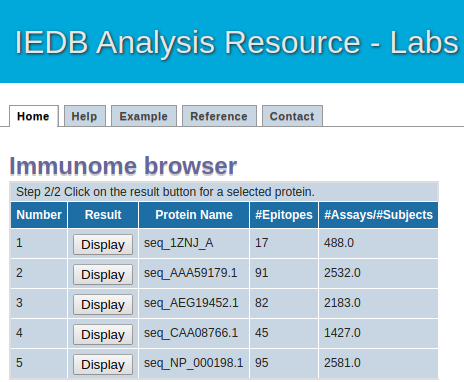
How to use the tool : Step 2
Intermediate Step
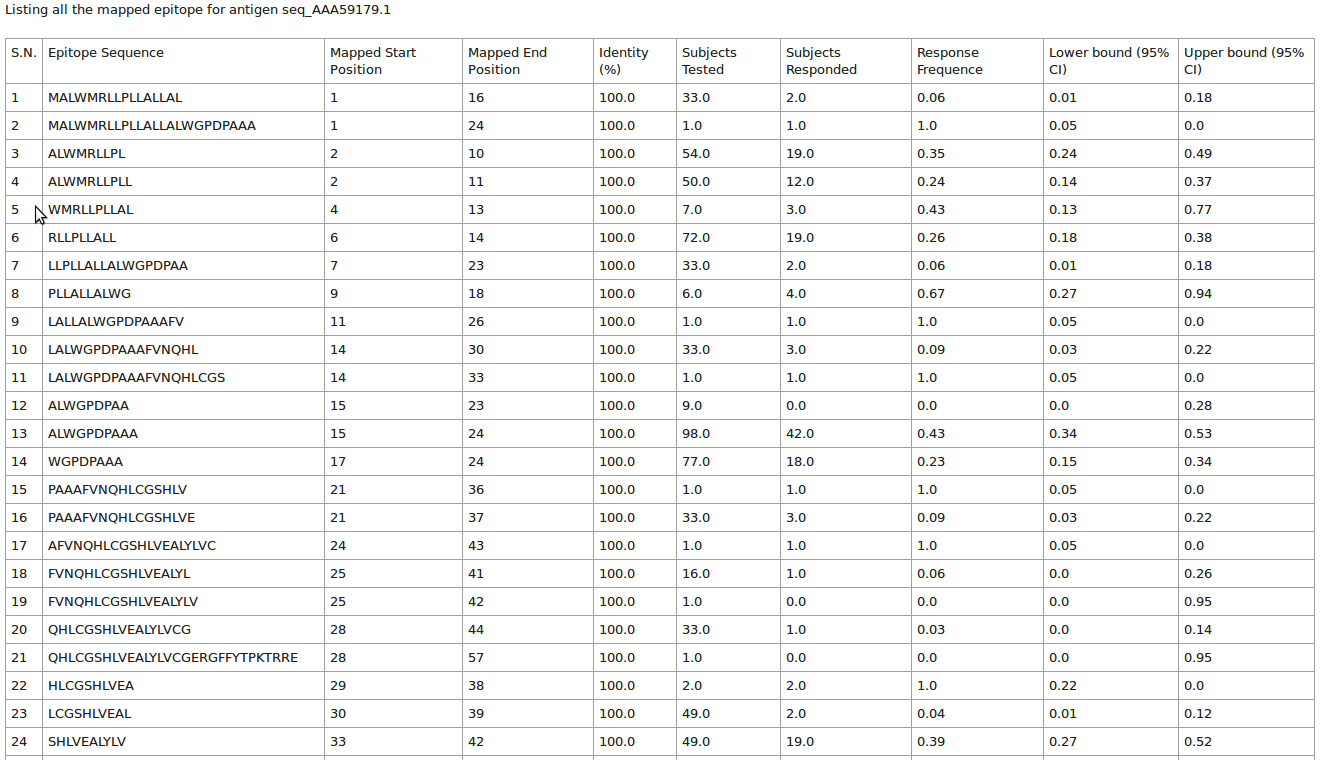
This page will list all the antigen (protein) sequence alongiwith their epitope mapped and total assay count in tabular format
Please click on the "Result" button to see the details of eptitope mapped at each postion of antigen (protein) sequence.
Please click on the "Result" button to see the details of eptitope mapped at each postion of antigen (protein) sequence.
Intermediate page
How to use the tool : Step 3
How the results are presented
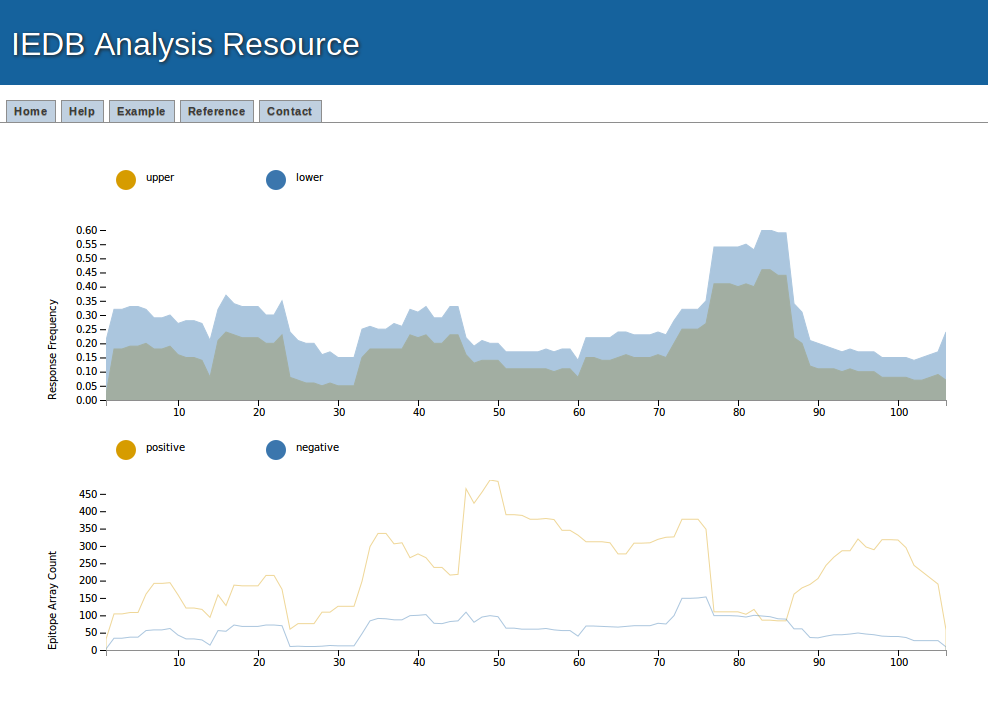
1. Graphical presentation
Example result visualization
The assay data (positive and negative assays) and response frequency (Upper and lower bound of response frequency) can be visualize here with mouse hover. It also has the facility to zoom-in and zoom-outs.